Applications to Lithium and other Rare Earth Minerals, CO₂ Storage and EOR using the HAWK Instrument
- Wildcat Technologies
- Apr 12, 2022
- 6 min read
Note 040522-1 Albert Maende, Wildcat Technologies
HAWK Pyrolysis, TOC & Carbonate Carbon instrument’s applications to CO₂ Storage and EOR (Enhanced Oil Recovery) analyses will be discussed in the following format:
Exploration for Lithium and other Rare Earth Minerals.
Evaluation of CO₂ geological storage potential that is available after Enhanced Oil Recovery (EOR).
EOR (Enhanced Oil Recovery) evaluation of geological formations based on reservoir characterization on the basis of sequence stratigraphic packages of lithofacies, their TOC (Total Organic Carbon), present day petroleum content, their petroleum generation potential, maturity, and prediction of API gravity and porosity.
Two main types of pyrolysis methods for hydrocarbons, organic carbon and carbonates analysis: Classical Pyrolysis and HAWK-PAM.
Classical Pyrolysis; analysis used to determine TOC, thermally vaporizable oil (S1) at 300 °C, hydrocarbons yield from pyrolysis of kerogen (S2) from 300 °C to 650 °C, measurements of both CO and CO₂ (S3CO and S3CO2), maturity (Tmax), and non-generating organic carbon content from the oxidation cycle’s CO and
CO₂ (S4CO and S4CO₂) from 300 °C – 750 °C. Also determined is the carbonate content (CaCO3 equivalent) by measuring the CO₂ content during oxidation, up to 850 °C.
Classical Pyrolysis results format and pyrogram


HAWK-PAM; this analysis methodology is done by initiating pyrolysis on whole rock or fluid samples starting at 50 °C and then ramped up to 650 °C through 5 separate zones which results in 5 peaks:
The oil fractions at 50 °C to 100 °C (Oil-1 is C4 – C5), at 100 °C (Oil-2 is C6 – C10), at 100 °C to 180 °C (Oil-3 is C11 – C19), at 180 °C to 350 °C (Oil-4 is C20 – C36).
The last peak from 350 °C to 650 °C (K-1 is C37+), which is mainly kerogen or resins and asphalt if the latter happen to be present.
HAWK-PAM enables better quantification of volatile oil than was previously possible on pyrolysis instruments (Maende et. al., 2017). This method enables measurement of API Gravity from drill cuttings, cores, outcrop samples, soil samples and oils. Also, maturity is more accurately measured and recorded as Tmax K-1 (°C).
HAWK-PAM results format and pyrogram


1. Exploration for Lithium and other Rare Earth Minerals.
Based on the premise that the brines or ore occurrences that are enriched in Lithium Carbonate are also likely to be enriched in other Rare Earth Minerals, then analyses of brines, outcrop and ore samples for Lithium Carbonate enrichment simultaneously achieves the goal of analyzing for Rare Earth Minerals too.
Lithium Carbonate is analyzed on the HAWK instrument in the same methodology that is used for analyzing other carbonates on the HAWK.
Occurrence of carbonates in brines, outcrops and ore samples is measured on the HAWK instrument and their pertinent Calcium Carbonate equivalent weight per cent (CaCO₃ equiv. wt. %) values are determined. Using the HAWK, one can distinguish the various types of carbonate minerals. The associated calcium carbonate percentages of these minerals can then be calculated and these match the values that are obtained through using the X-Ray Diffraction (XRD) method.
Table 1 below shows an example of HAWK results obtained when carbonate minerals were analyzed.

Table 1. Example of Carbonate minerals analytical results obtained on the HAWK instrument (Note: CaCO₃ equivalent (wt. %) = (CC x 100)/12)
Note: CaCO₃ equivalent (wt. %) = (CC x 100)/12
A comparison of HAWK instrument results with those of XRD measurements on Carbonate rocks are shown in Table 2.

Table 2. Comparison of HAWK and XRD results on Carbonate rock samples
Examples of pyrograms of Carbonate minerals on the HAWK instrument are shown below. These HAWK pyrograms are for Siderite, Calcite and Dolomite.

2. Evaluation of CO₂ geological storage potential that is available after Enhanced Oil Recovery (EOR)
The CO₂ geological storage potential is determined as being equivalent to the hydrocarbons filled pore volume that is available for Enhanced Oil Recovery (EOR). The procedure that would be used to determine the CO₂ geological storage potential is therefore the same as that used to determine hydrocarbon filled pore volume that is available for EOR and would then equate the available pore volume that remains after completion of EOR.
The procedure for determination of hydrocarbons filled pore volume that is available for EOR is as illustrated below using the five samples that were retrieved from a well that was cored and whose HAWK-PAM (Maende et. al., 2017) analytical results are shown in the two tables below:

HAWK-PAM/TOC-CC results for 5 core samples

HAWK-PAM/TOC/CC results for 5 core samples expressed as petroleum fractions of refinery products
These 5 core samples were analyzed using XRD and their results are shown in the two tables below:


XRD results for 5 core samples
The grain density for each of the 5 core samples was then computed based on the XRD mineralogy results of each sample together with the HAWK-PAM/TOC-CC method’s determination of the TOC and Kerogen/Asphalt content of each of these 5 core samples. Utilizing the HAWK-PAM/TOC-CC and XRD results together with the pertinent API gravity and specific gravity values for the total oil content, kerogen, carbonates, quartz, feldspar and clay minerals, computations for their volume percentages together with that for bulk density were done. The Porosity together with the Pore volume that is occupied by hydrocarbons for each of these 5 core samples was then computed with their respective Sw values; these results are shown below:

Pore volume of total oil saturation (So) together with Pore volume of water saturation (Sw)
The Pore volume of So (Total Oil Saturation) shown above, is the total pore volume for each of the 5 core samples, that is filled by hydrocarbons which can be produced using Enhanced Oil Recovery (EOR) and therefore this So (Total Oil Saturation) is the pore volume that will then be available for CO₂ storage after EOR.
3. EOR (Enhanced Oil Recovery) evaluation of geological formations based on reservoir characterization on the basis of sequence stratigraphic packages of lithofacies, their TOC (Total Organic Carbon) measured on the HAWK pyrolysis instrument, their present day petroleum content, their petroleum generation potential, maturity, and prediction of API gravity and porosity (determined using HAWK-PAM), are depicted in the six graphs below of the HAWK pyrolysis instrument’s analysis of Marcellus Shale core samples that were retrieved from a well which was drilled in the Appalachian Basin (Comet et. al., 2015)
i. The graphs Bitumen (EOM)/TOC and Kerogen plus any Asphalt/TOC ratios were determined through conversion of their HAWK-PAM rock measurement’s mg HC/g rock, values to their respective organic carbon using the assumption that 85% of hydrocarbons content is organic carbon; these values were then normalized to their respective TOC (Total Organic Carbon) measurements (Maende et. al., 2020).
ii. The other four graphs are those for Sequence Stratigraphy: TOC vs Depth, Maturity (Tmax vs Depth), API gravity prediction vs Depth and Porosity prediction vs Depth.

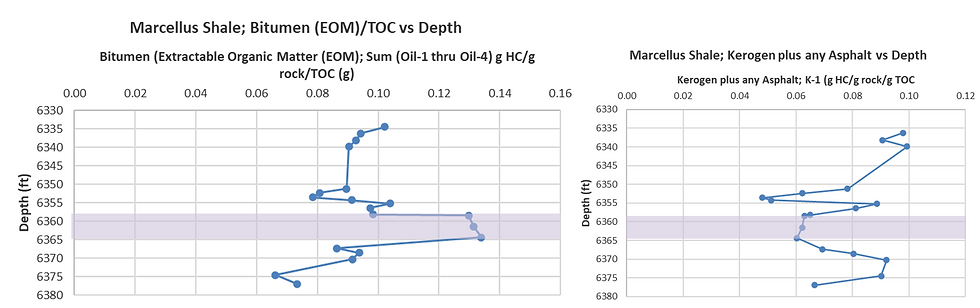


The area highlighted in purple in the above shown charts is for the 6358. 45 ft to 6364.35 ft depth interval of the Marcellus Shale well that was drilled in the Appalachian Basin.
The predicted API gravity values for the three samples that were retrieved from this purple color highlighted zone are 50, 52 and 53 for 6358.45 ft, 6361.50 ft and 6364.35 ft respectively, are therefore indicative of condensate/wet gas occurrence as attested by its maturity Tmax values that range from 460 °C to 463 °C. This 6358. 45 ft to 6364.35 ft depth interval, not only has the highest API gravity, but it also has the highest Bitumen (EOM)/TOC ratio and the highest porosity and is therefore the best producible petroleum sweet spot for placing a lateral out of the entire cored interval of 6334.50 ft to 6376.95 ft.
As would be anticipated for a zone that has already done considerable generation of petroleum, the 6358. 45 ft to 6364.35 ft depth interval has almost the least TOC (5% to 7%) and also almost the least Kerogen plus any Asphalt content out of the entire cored interval of 6334.50 ft to 6376.95 ft which penetrated Marcellus U.M. TST, Marcellus L.M. HST and Marcellus L.M. TST stratigraphic sequences.
This 6358. 45 ft to 6364.35 ft depth interval whose top occurs at the base of the Marcellus L.M. HST and which bottoms up in the Marcellus L.M. TST stratigraphic sequence, is not only the best target out of the entire cored interval, for perforation to produce petroleum but it is also the best target for EOR (Enhanced Oil Recovery) and subsequent CO₂ Storage after the EOR is complete.
References
Comet, P., C. Stringer, C. Scheibe, A. Maende, and E. Boice, 2015, Using XRF, SEM, and Pyrolysis for an Economic Appraisal of the Marcellus Formation of Western Virginia for Hydraulic Fracturing Purposes: AAPG Search and Discovery Article #41629 (2015). http://www.searchanddiscovery.com/documents/2015/41629comet/ndx_comet.pdf
Maende, A., B. Horsfield, S. Kuske, B. Jarvie, D. Jarvie and W. D. Weldon, 2020, Investigation and Identification of Pyrolysis Attributes that Can Assist in Predicting Producible Hydrocarbon in the Unconventional Eagle Ford Formation, Search and Discovery Article #80733 (2020), AAPG.
https://www.searchanddiscovery.com/documents/2020/80733maende/ndx_maende.pdf Accessed on July 12th, 2021.
Maende, A., A. Pepper, D. M. Jarvie, and W. D. Weldon, 2017, Advanced Pyrolysis Data and Interpretation Methods to Identify Unconventional Reservoir Sweet Spots in Fluid Phase Saturation and Fluid Properties (API Gravity) From Drill Cuttings and Cores, Search and Discovery Article #80596 (2017), Adapted from oral presentation given at AAPG 2017 Annual Convention and Exhibition, Houston, Texas, April 2-5, 2017. http://www.searchanddiscovery.com/pdfz/documents/2017/80596maende/ndx_maende.pdf.html
Accessed on July 12th, 2021.
Download a PDF copy of Application Note below.
Copyright © 2022 Wildcat Technologies, LLC. All Rights Reserved.
Strictly prohibited unauthorized copying or use without the owner's written permission, visitor may use links or linked excerpts with clear, complete credit.


Comments